
Climate Action Plan
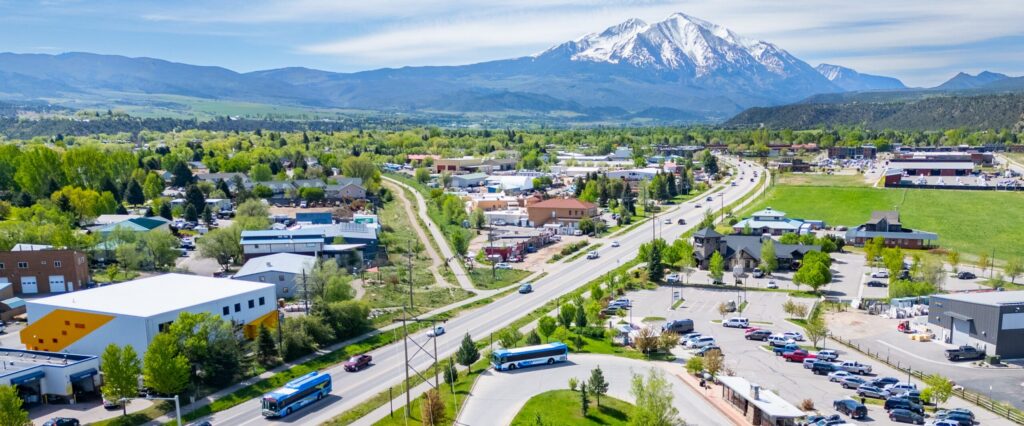
Climate change affects everyone across RFTA’s 70-mile service region, bringing greater risks of air pollution, extreme weather, and harm to local ecosystems. Transportation is the largest source of greenhouse gas emissions in the United States, making it a critical area for action. RFTA developed its Climate Action Plan (CAP) from October 2022 to May 2023, drawing on input from riders, staff, and regional partners, as well as a review of more than 50 climate and sustainability plans from around the country. As a living, data-driven framework, the CAP evolves with new data, technology, and partnerships. This snapshot highlights RFTA’s current progress and where we’re headed next.
What is the source of RFTA’s greenhouse gas (GHG) emissions?
RFTA’s “direct” greenhouse gas (GHG) emissions source from operating buses and support vehicles, as well as from the electricity and natural gas necessary to operate facilities.
-
24% From Facilities
Electricity and Natural Gas -
76% From Fleet
Gasoline, diesel and CNG
* Data based off of 2019 baseline
| Label | Value |
|---|---|
| From Facilities | 24 |
| From Fleet | 76 |

How emissions offset happen
RFTA helps reduce regional greenhouse gas emissions by providing reliable and convenient alternatives to driving. When people choose transit, the Rio Grande Trail, WE-cycle, or utilize microtransit options instead of personal vehicles, they reduce their carbon footprint, support cleaner air, and help lower emissions across the region. RFTA’s investments in service reliability and accessibility help more people make sustainable transportation choices.
What are RFTA’s climate action goals?
The Climate Action Plan uses 2019 as its baseline year, as it represents a typical pre-pandemic year. All adopted goals and future emissions projects are based on 2019 data.
GOAL: Reduce RFTA's Direct Emissions
RFTA will reduce direct GHG emissions from fleet and facilities.
- 50% reduction by 2030
- 90% reduction by 2050
GOAL: Offset Regional Greenhouse Gas Emissions
RFTA will offset emissions by shifting personal automobile trips to transit.
- Transit will offset 3 times its emissions by 2030
- Transit will offset 5 times its emissions by 2050
What progress has been made?
RFTA’s projections assume current levels of service for both charts.
*Metric Tons Carbon Dioxide Equivalent (MTCO2e)
How will we reach our climate action goals?
RFTA’s priority strategies:
- Fleet electrification
- Facility electrification
- Development of on-site renewable energy systems
- Transit priority lanes
- Mobility hubs & transit expansion
- Affordable fares


Bus fleet composition comparison
2025
| Label | Value |
|---|---|
| CNG | 37 |
| Diesel | 57 |
| Battery Electric | 6 |
Versus
2030 (Projected)
| Label | Value |
|---|---|
| CNG | 20 |
| Hybrid Electric | 5 |
| Diesel | 48 |
| Battery Electric | 27 |
2026 Climate Action Projects
- 11 new zero-emission battery electric buses (BEBs),
replacing old diesel buses - Support vehicle electrification planning
- Facility charging infrastructure
- Regional bus service expansion (SB-230 state funding)
